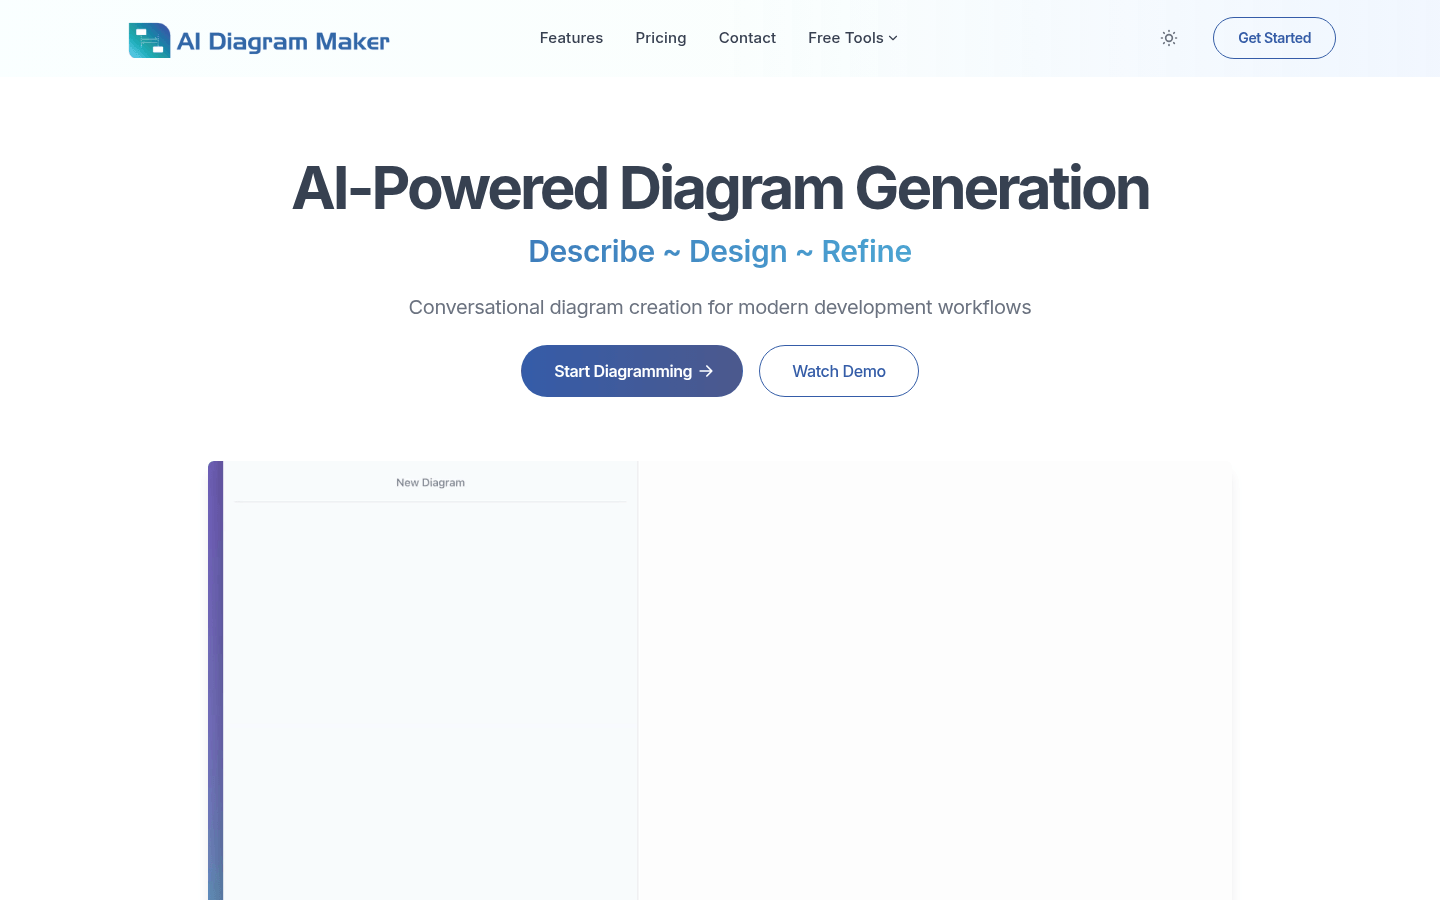
AI Diagram Maker is a diagram generation tool based on artificial intelligence, designed to solve the complex and time-consuming problems of traditional diagram making tools. Its importance lies in greatly improving the efficiency of chart production, allowing users to quickly visualize complex systems. The main advantages include: through natural language interaction, there is no need for complicated operation processes; it can convert existing documents, notes, etc. into charts; it automatically processes layout and styles to generate professional results; it supports export in multiple formats. The product is positioned for developers, architects, project managers and other people who need to make diagrams, helping them save time and energy. The price document does not mention it, but it is speculated that there may be a free trial and a paid version.
Demand group:
["Developers: Developers spend a lot of time designing software architecture, drawing flow charts, etc. AI Diagram Maker can quickly convert their ideas into diagrams, saving time and energy, and improving development efficiency.", "Architects: Architects need to visualize complex system architectures. This tool can easily generate professional architecture diagrams through natural language interaction, and can quickly modify and adjust according to needs.", "Project managers: Project managers need to use charts to display project progress, processes and other information, AI Diagram Maker can help them quickly generate clear and understandable diagrams to facilitate team communication and project management. "]
Example of usage scenario:
When developers design the software login process, they only need to enter "the user calls the login API, which verifies the credentials with the database, redirects to the homepage if successful, and redirects to login if failed" to quickly generate a flow chart.
When architects plan microservice architecture, they upload architectural ideas in the form of documents, and AI Diagram Maker can convert them into professional architecture diagrams.
When project managers make project progress charts, they use natural language to describe the project process. This tool can quickly generate clear flow charts for project reporting and team communication.
Product features:
AI-driven chart generation and editing: Users can use concise natural language descriptions to generate charts, and can edit and optimize the generated charts through natural conversations without complex operation processes.
Create charts from attachments: Users can upload pictures, documents or notes, and AI will automatically convert them into structured charts, allowing users to quickly utilize existing information.
Automatic layout and style processing: AI will automatically handle the positioning, alignment and design of elements in charts without the need for manual adjustments by users, and can instantly generate professional chart effects.
Multi-format export: Supports downloading the generated charts in the form of PNG, SVG or chart code, suitable for documents, presentations or code warehouses.
Quick code editing: Users can switch to the code view and edit the chart code directly, or let AI modify the code through dialogue.
Chart Revision History Tracking: Users can track the change history of charts and be able to revert to previous versions when using the Plus and Max plans.
Usage tutorial:
1. Visit the website: Open the browser and visit the official website of AI Diagram Maker https://aidiagrammaker.com.
2. Enter a description: Use natural language to describe the diagram to be created in the input box, such as system process, architectural design, etc.
3. Generate charts: AI will automatically generate corresponding charts based on the input description.
4. Editing and optimization: If you need to modify the chart, you can make a request to the AI through natural dialogue, and the AI will make corresponding adjustments.
5. Export the chart: After completing the chart production, select the appropriate format (such as PNG, SVG or chart code) to download and save the chart.


